Groundwater Analysis Report (GAR)
import matplotlib.pyplot as plt
import brodata
Download a GroundwaterAnalysisReport using GroundwaterAnalysisReport.from_bro_id(bro_id). The object contains the data from the BRO XML file.
gar = brodata.gar.GroundwaterAnalysisReport.from_bro_id("GAR000000019636")
gar
GroundwaterAnalysisReport(broId='GAR000000019636')
Measurements are stored in the laboratoryAnalysis attribute (a pandas DataFrame).
gar.laboratoryAnalysis
| analyticalTechnique | valuationMethod | parameter | analysisMeasurementValue | uom | qualityControlStatus | limitSymbol | |
|---|---|---|---|---|---|---|---|
| analysisDate | |||||||
| 1982-02-12 | None | None | 3548 | 126.55 | mS/m | goedgekeurd | NaN |
| 1982-02-12 | None | None | 1398 | 7.00 | 1 | goedgekeurd | NaN |
| 1982-02-12 | None | None | 374 | 345.00 | mg/l | goedgekeurd | NaN |
| 1982-02-12 | None | None | 289 | 0.54 | mg/l | goedgekeurd | NaN |
| 1982-02-12 | None | None | 447 | 145.00 | mg/l | goedgekeurd | NaN |
| 1982-02-12 | None | None | 508 | 165.00 | mg/l | goedgekeurd | NaN |
| 1982-02-12 | None | None | 4188 | 0.22 | mg/l | goedgekeurd | NaN |
| 1982-02-12 | None | None | 920 | 2.00 | mg/l | goedgekeurd | NaN |
| 1982-02-12 | None | None | 1318 | 5.00 | mg/l | goedgekeurd | NaN |
| 1982-02-12 | None | None | 1125 | 14.00 | mg/l | goedgekeurd | NaN |
| 1982-02-12 | None | None | 1262 | 95.00 | mg/l | goedgekeurd | NaN |
| 1982-02-12 | None | None | 1270 | 0.10 | mg/l | goedgekeurd | LT |
| 1982-02-12 | None | None | 1508 | 95.00 | mg/l | goedgekeurd | NaN |
Use to_dict() to view the remaining contents of the GroundwaterAnalysisReport.
gar_data = gar.to_dict()
gar_data.pop("laboratoryAnalysis")
gar_data
{'broId': 'GAR000000019636',
 'corrected': 'ja',
 'deliveryAccountableParty': '30276683',
 'deregistered': 'nee',
 'fieldObservation': {'abnormalityInCooling': 'nee',
  'abnormalityInDevice': 'nee',
  'pollutedByEngine': 'nee',
  'filterAerated': 'onbekend',
  'groundWaterLevelDroppedTooMuch': 'onbekend',
  'abnormalFilter': 'nee',
  'sampleAerated': 'onbekend',
  'hoseReused': 'ja',
  'temperatureDifficultToMeasure': 'nee'},
 'fieldResearch': Empty DataFrame
 Columns: []
 Index: [],
 'groundwaterMonitoringNet': 'GMN000000000523',
 'groundwaterMonitoringWell': 'GMW000000038534',
 'id': 'BRO_0003',
 'latestCorrectionTime': '2026-02-20T14:16:45+01:00',
 'objectRegistrationTime': '2023-01-10T20:05:19+01:00',
 'qualityControlMethod': 'onbekend',
 'qualityRegime': 'IMBRO/A',
 'registrationCompletionTime': '2023-01-10T20:05:19+01:00',
 'registrationStatus': 'voltooid',
 'reregistered': 'nee',
 'tubeNumber': 1,
 'underReview': 'nee'}
Multiple objects
All measurements of one tube
gmw_id = "GMW000000017707"
tube_number = 1
df = brodata.gmw.get_tube_observations(gmw_id, tube_number, kind="gar")
df
| analyticalTechnique | valuationMethod | parameter | analysisMeasurementValue | uom | limitSymbol | reportingLimit | qualityControlStatus | |
|---|---|---|---|---|---|---|---|---|
| analysisDate | ||||||||
| 1991-07-01 | AAS | CIW | 447 | 31.00 | mg/l | NaN | NaN | goedgekeurd |
| 1991-07-01 | AAS | CIW | 1125 | 4.80 | mg/l | NaN | NaN | goedgekeurd |
| 1991-07-01 | AAS | CIW | 289 | 0.02 | mg/l | NaN | NaN | goedgekeurd |
| 1991-07-01 | AAS | CIW | 1128 | 240.00 | ug/l | NaN | NaN | goedgekeurd |
| 1991-07-01 | AAS | CIW | 1398 | 5.25 | 1 | NaN | NaN | goedgekeurd |
| ... | ... | ... | ... | ... | ... | ... | ... | ... |
| 2024-03-15 | AAS | CIW | 1398 | 5.36 | 1 | NaN | 5.36 | onbeslist |
| 2024-03-15 | AAS | CIW | 1522 | 20.00 | Cel | NaN | 20.00 | goedgekeurd |
| 2024-03-15 | AAS | CIW | 1334 | 0.01 | mg/l | NaN | 0.01 | goedgekeurd |
| 2024-03-15 | AAS | CIW | 1480 | 0.03 | ug/l | LT | 0.03 | goedgekeurd |
| 2024-03-15 | AAS | CIW | 365 | 0.02 | ug/l | LT | 0.02 | goedgekeurd |
2435 rows × 8 columns
parameter_list = brodata.gar.get_parameter_list()
parameter_list
| description | aquoCode | aspect | casNumber | id | unit | |
|---|---|---|---|---|---|---|
| code | ||||||
| 10 | 1,1-dichloorpropaan | 11DClC3a | NVT | 78-99-9 | 10 | ug/l |
| 100 | 2,4,5-trichlooraniline | 245TClAn | NVT | 636-30-6 | 100 | ug/l |
| 101 | 2,4,5-trichloorfenol | 245TClFol | NVT | 95-95-4 | 101 | ug/l |
| 102 | 2,4,5-trichloorfenoxyazijnzuur | 245T | NVT | 93-76-5 | 102 | ug/l |
| 103 | 2,4,5-trichloorfenoxypropionzuur | 245TP | NVT | 93-72-1 | 103 | ug/l |
| ... | ... | ... | ... | ... | ... | ... |
| 921 | Kaliumpermanganaat verbruik | PMV | NVT | NVT | 921 | mg/l |
| 93 | 2,3-dichlooraniline | 23DClAn | NVT | 608-27-5 | 93 | ug/l |
| 94 | 2,3-dichloorfenol | 23DClFol | NVT | 576-24-9 | 94 | ug/l |
| 967 | koolstofdisulfide | CS2 | NVT | 75-15-0 | 967 | ug/l |
| 971 | koper | Cu | nf | 7440-50-8 | 971 | ug/l |
1086 rows × 6 columns
# add the parameter description
df["parameter_description"] = parameter_list.loc[df["parameter"], "description"].values
# show all the unique parameters and the number of measurements
parameter_description_counts = df["parameter_description"].value_counts()
parameter_description_counts
parameter_description
calcium          21
magnesium        21
ammonium         21
natrium          21
zink             21
                 ..
ofloxacine        1
oxadiazon         1
propaquizafop     1
propyfenazon      1
prochloraz        1
Name: count, Length: 727, dtype: int64
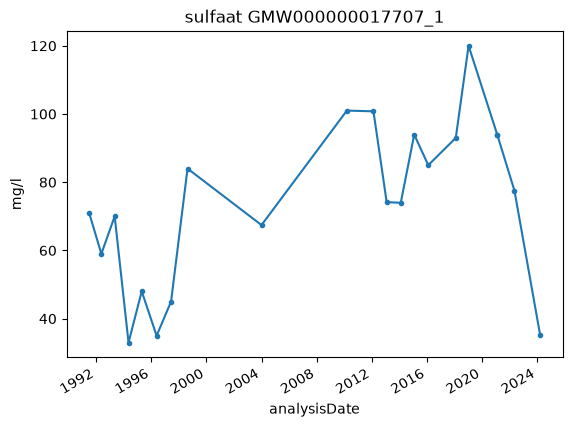
parameter_description = "sulfaat"
parameter_code = brodata.gar.get_parameter_code(parameter_description, parameter_list=parameter_list)
mask = df["parameter"] == parameter_code
ax = df.loc[mask, "analysisMeasurementValue"].plot(marker=".")
uom = df.loc[mask, "uom"].unique()
assert len(uom) == 1
ax.set_ylabel(uom[0])
ax.set_title(f"{parameter_description} {gmw_id}_{tube_number}");
All measurements within an extent
As with Groundwater Level Dossiers, you can download GAR data within an extent via brodata.gm.get_data_in_extent or brodata.gmw.get_data_in_extent. Both return a GeoDataFrame where laboratoryAnalysis contains measurement data and groundwaterAnalysisReport lists GAR BRO IDs for each tube.
For simplicity we use brodata.gm.get_data_in_extent (see the GLD example).
extent = [115000, 120000, 438000, 441000]
gdf = brodata.gm.get_data_in_extent(extent=extent, kind="gar", combine=True)
/home/docs/checkouts/readthedocs.org/user_builds/brodata/envs/latest/lib/python3.13/site-packages/brodata/gmw.py:810: PerformanceWarning: indexing past lexsort depth may impact performance.
  if index not in obs_df.index:
/home/docs/checkouts/readthedocs.org/user_builds/brodata/envs/latest/lib/python3.13/site-packages/brodata/gmw.py:810: PerformanceWarning: indexing past lexsort depth may impact performance.
  if index not in obs_df.index:
/home/docs/checkouts/readthedocs.org/user_builds/brodata/envs/latest/lib/python3.13/site-packages/brodata/gmw.py:810: PerformanceWarning: indexing past lexsort depth may impact performance.
  if index not in obs_df.index:
/home/docs/checkouts/readthedocs.org/user_builds/brodata/envs/latest/lib/python3.13/site-packages/brodata/gmw.py:810: PerformanceWarning: indexing past lexsort depth may impact performance.
  if index not in obs_df.index:
gdf.T
| gmw_bro_id | GMW000000038534 | GMW000000040467 | ||
|---|---|---|---|---|
| tube_number | 1 | 2 | 1 | 3 |
| geometry | POINT (115429.97423841307 438779.949886862) | POINT (115429.97423841307 438779.949886862) | POINT (115429.97423841307 438779.949886862) | POINT (115429.97423841307 438779.949886862) |
| gm_gmw_monitoringtube_pk | 38840 | 38841 | 42394 | 42395 |
| gm_gmw.href | https://api.pdok.nl/tno/bro-grondwatermonitori... | https://api.pdok.nl/tno/bro-grondwatermonitori... | https://api.pdok.nl/tno/bro-grondwatermonitori... | https://api.pdok.nl/tno/bro-grondwatermonitori... |
| gm_gmw_fk | 29773 | 29773 | 31606 | 31606 |
| tube_status | onbekend | onbekend | onbekend | onbekend |
| tube_in_use | ja | ja | ja | ja |
| tube_top_diameter | NaN | NaN | NaN | NaN |
| screen_top_position | -15.16 | -23.26 | -12.96 | -23.96 |
| screen_bottom_position | -17.16 | -25.26 | -14.96 | -25.96 |
| electrode_top_position | NaN | NaN | NaN | NaN |
| electrode_bottom_position | NaN | NaN | NaN | NaN |
| laboratoryAnalysis | analyticalTechnique valuationMeth... | analyticalTechnique valuationMeth... | analyticalTechnique valuationMeth... | analyticalTechnique valuationMeth... |
| groundwaterAnalysisReport | [GAR000000019636, GAR000000019637, GAR00000001... | [GAR000000019646, GAR000000019647, GAR00000001... | [GAR000000038330, GAR000000038331, GAR00000003... | [GAR000000038290, GAR000000038291, GAR00000003... |
Plot the GeoDataFrame to inspect locations; some monitoring wells may overlap.
f, ax = plt.subplots()
ax.axis("scaled")
ax.axis(extent)
gdf.plot(ax=ax);
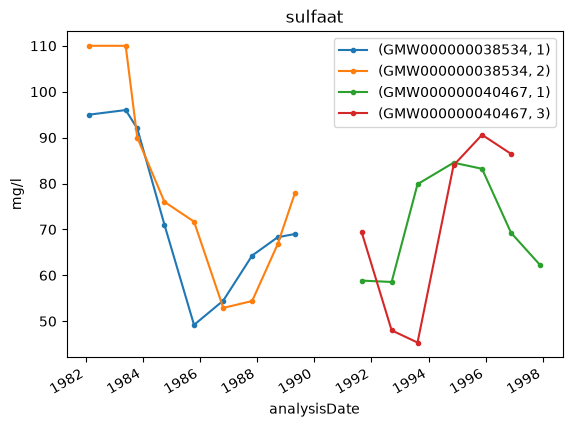
Plot measurement series for the tubes in a single figure.
f, ax = plt.subplots()
parameter_description = "sulfaat"
parameter_code = brodata.gar.get_parameter_code(parameter_description, parameter_list=parameter_list)
uom = "mg/l"
for index in gdf.index:
    df = gdf.at[index, "laboratoryAnalysis"]
    mask = df["parameter"] == parameter_code
    if not mask.any():
        continue
    assert (df.loc[mask, "uom"] == uom).all()
    ax = df.loc[mask, "analysisMeasurementValue"].plot(marker=".", ax=ax, label=index)
ax.set_ylabel(uom)
ax.set_title(parameter_description)
ax.legend();