Grondwatermonitoring (GM) in samenhang
Downloading head-data using for Groundwater Monitoring Wells (All measurements within an extent (option 2: brodata.gmw.get_data_in_extent)) can require a lot of requests to the BRO-REST-service: characteristics, GrounwaterMonitoringWells and GroundwaterLevelDossiers/GroundwaterAnalysisReports. To simplify this process PDOK hosts the dataset “Grondwatermonitoring (GM) in samenhang” (available since 2024), which contains summary and characteristic information about registration objects within the groundwater monitoring domain, including the relationships between these registration objects. It provides key data such as the horizontal and vertical positions of measurement tubes, but not full well or tube metadata.
Previously (All measurements within an extent (option 1: brodata.gm.get_data_in_extent)) we demonstrated the use of this dataset to download groundwater heads within a specific area. In this notebook we will show more options to use this dataset, for example to filter the monitoring tubes before downloading actual measurements.
import matplotlib.pyplot as plt
import brodata
Download location of tubes
First we will download the location of grundwater monitoring tubes by calling brodata.gm.get_data_in_extent with the argument kind=None. This only requires a singe request to the PDOK-webservice, and resurns a GeoDataFrame. The index of this GeoDataFrame contains the bro-id of the Groundwater Monitoring Well and the tube number.
extent = [117700, 118700, 439400, 440400]
tubes = brodata.gm.get_data_in_extent(extent, kind=None)
tubes
| geometry | gm_gmw_monitoringtube_pk | gm_gmw.href | gm_gmw_fk | tube_status | tube_in_use | tube_top_diameter | screen_top_position | screen_bottom_position | electrode_top_position | electrode_bottom_position | ||
|---|---|---|---|---|---|---|---|---|---|---|---|---|
| gmw_bro_id | tube_number | |||||||||||
| GMW000000036286 | 1 | POINT (117810.309 439763.429) | 36388 | https://api.pdok.nl/tno/bro-grondwatermonitori... | 27655 | gebruiksklaar | ja | 63.0 | -2.194 | -3.194 | None | None |
| GMW000000036287 | 1 | POINT (118300.365 439767.464) | 36389 | https://api.pdok.nl/tno/bro-grondwatermonitori... | 27656 | gebruiksklaar | ja | 63.0 | 0.142 | -0.858 | None | None |
| GMW000000036308 | 1 | POINT (118049.119 440003.006) | 36410 | https://api.pdok.nl/tno/bro-grondwatermonitori... | 27677 | gebruiksklaar | ja | 63.0 | -1.289 | -2.289 | None | None |
| GMW000000036318 | 1 | POINT (118395.903 440169.549) | 36420 | https://api.pdok.nl/tno/bro-grondwatermonitori... | 27687 | gebruiksklaar | ja | 63.0 | -2.029 | -3.028 | None | None |
| GMW000000036319 | 1 | POINT (117956.994 439698.197) | 36421 | https://api.pdok.nl/tno/bro-grondwatermonitori... | 27688 | gebruiksklaar | ja | 63.0 | -1.721 | -2.721 | None | None |
| GMW000000036327 | 1 | POINT (118064.181 439799.93) | 36429 | https://api.pdok.nl/tno/bro-grondwatermonitori... | 27696 | gebruiksklaar | ja | 63.0 | -0.833 | -1.833 | None | None |
| GMW000000036328 | 1 | POINT (118342.321 439964.201) | 36430 | https://api.pdok.nl/tno/bro-grondwatermonitori... | 27697 | gebruiksklaar | ja | 63.0 | 0.795 | -0.205 | None | None |
| GMW000000036339 | 1 | POINT (118632.006 439909.352) | 36441 | https://api.pdok.nl/tno/bro-grondwatermonitori... | 27708 | gebruiksklaar | ja | 63.0 | -2.695 | -3.695 | None | None |
| GMW000000036354 | 1 | POINT (117961.245 440134.173) | 36456 | https://api.pdok.nl/tno/bro-grondwatermonitori... | 27723 | gebruiksklaar | ja | 63.0 | -1.987 | -2.987 | None | None |
| GMW000000036365 | 1 | POINT (118127.453 439683.098) | 36467 | https://api.pdok.nl/tno/bro-grondwatermonitori... | 27734 | gebruiksklaar | ja | 63.0 | -0.429 | -1.428 | None | None |
| GMW000000036371 | 1 | POINT (117912.255 439993.558) | 36473 | https://api.pdok.nl/tno/bro-grondwatermonitori... | 27740 | gebruiksklaar | ja | 63.0 | -1.200 | -2.200 | None | None |
| GMW000000049567 | 1 | POINT (117892.583 439651.861) | 54853 | https://api.pdok.nl/tno/bro-grondwatermonitori... | 40472 | onbekend | ja | NaN | -1.950 | -2.950 | None | None |
| 2 | POINT (117892.583 439651.861) | 54854 | https://api.pdok.nl/tno/bro-grondwatermonitori... | 40472 | onbekend | ja | NaN | -14.000 | -15.000 | None | None | |
| GMW000000088148 | 1 | POINT (118389.168 440186.234) | 101187 | https://api.pdok.nl/tno/bro-grondwatermonitori... | 75843 | gebruiksklaar | onbekend | 63.0 | -2.829 | -3.829 | None | None |
| GMW000000088161 | 1 | POINT (118046.785 440218.965) | 101202 | https://api.pdok.nl/tno/bro-grondwatermonitori... | 75856 | gebruiksklaar | onbekend | 63.0 | -1.364 | -2.364 | None | None |
| GMW000000088163 | 1 | POINT (118160.656 439678.979) | 101204 | https://api.pdok.nl/tno/bro-grondwatermonitori... | 75858 | gebruiksklaar | onbekend | 40.0 | 0.473 | -0.527 | None | None |
| GMW000000088164 | 1 | POINT (118206.559 439792.296) | 101205 | https://api.pdok.nl/tno/bro-grondwatermonitori... | 75859 | gebruiksklaar | onbekend | 40.0 | 0.860 | -0.140 | None | None |
| GMW000000088166 | 1 | POINT (118157.621 439915.469) | 101207 | https://api.pdok.nl/tno/bro-grondwatermonitori... | 75861 | gebruiksklaar | onbekend | 63.0 | 0.868 | -0.132 | None | None |
| GMW000000088168 | 1 | POINT (117910.727 439993.804) | 101209 | https://api.pdok.nl/tno/bro-grondwatermonitori... | 75863 | gebruiksklaar | onbekend | 63.0 | -1.413 | -2.413 | None | None |
| GMW000000088172 | 1 | POINT (117966.11 440143.381) | 101213 | https://api.pdok.nl/tno/bro-grondwatermonitori... | 75867 | gebruiksklaar | onbekend | 63.0 | -1.653 | -2.653 | None | None |
Making a selection of tubes
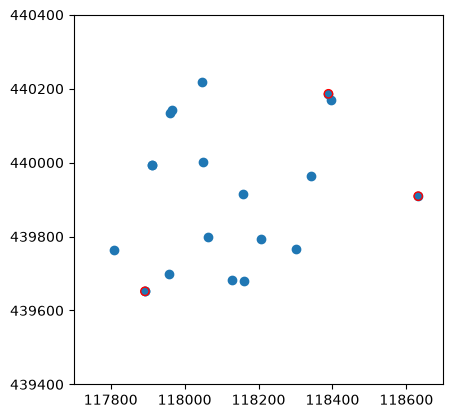
Before we will download measurements, we can make a selection. For example, we can select all tubes where the top of the well screen is below -2.5 m NAP.
We can then plot the selection of this GeoDataFrame on a map using tubes.plot().
max_screen_top_position = -2.5
mask = tubes['screen_top_position'] < max_screen_top_position
print(f"{mask.sum()} of {len(tubes)} tubes selected where screen_top_position < {max_screen_top_position}")
tubes_sel = tubes[mask]

f, ax = plt.subplots()
ax.axis("scaled")
ax.axis(extent)
tubes.plot(ax=ax)
tubes_sel.plot(ax=ax, marker='o', edgecolor='red', facecolor='none');
3 of 20 tubes selected where screen_top_position < -2.5
Downloading groundwater level data
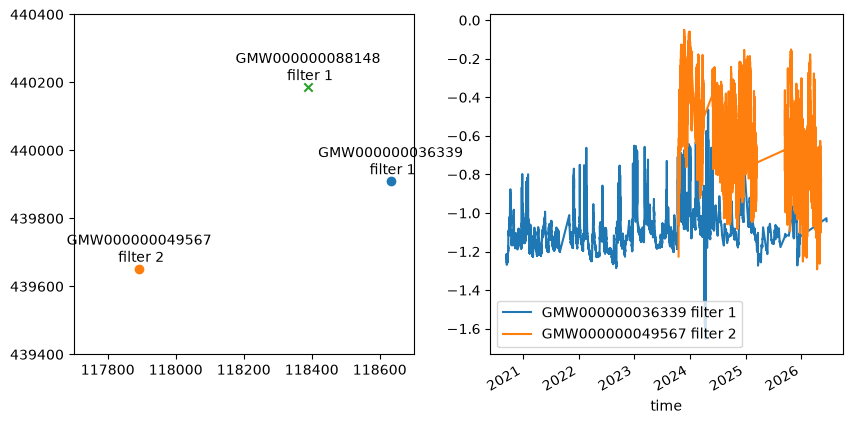
We can then download groundwater level data using brodata.gm.get_observations(). This downloads data for two of the three monitoring tubes. So the third monitoring tube does not contain any groundwater level data.
obs_df = brodata.gm.get_observations(extent=extent, tubes=tubes_sel, kind="gld", as_csv=True)
obs_df
GLD000000012845 contains 817 duplicates (of 31550). Keeping only first values (sorted for importance).
| observation | gm_gmw_monitoringtube_fk | groundwaterMonitoringWell | tubeNumber | |
|---|---|---|---|---|
| broId | ||||
| GLD000000012845 | value qualifier st... | 36441 | GMW000000036339 | 1 |
| GLD000000150449 | value qualifier st... | 54854 | GMW000000049567 | 2 |
Combining tubes and observations
We can then add these observations to the tubes-GeoDataFrame using the method brodata.gmw.add_observations_to_tubes. If multiple Groundwater Level Dossiers are available for a single monitoring tube, they are combined.
The index of the tubes-GeoDataFrame and the measurement-dataframe both needs to be a MultiIndex, with the bro-id of the GroundwaterMonitoringWell and the tube-number as the levels. For the tubes-GeoDataFrame this is allready the case, but for the measurement-Dataframe (obs_df) we need to change the index.
THe resulting GeoDataFrame contains all the columns from the tubes-GeoDataFrame, with the added columns observation and groundwaterLevelDossier. The column observation contains one DataFrame with observations per monitoring tube. THe column groundwaterLevelDossier contains a list of GroundwaterLevelDossier-ids per monitoring tube. If we would have downloaded GroundwaterAnalysisReports (kind="gar"), these columns would have been named laboratoryAnalysis and groundwaterAnalysisReport.
obs_df = obs_df.reset_index().set_index(["groundwaterMonitoringWell", "tubeNumber"])
tubes_sel = brodata.gmw.add_observations_to_tubes(tubes_sel, obs_df, kind="gld")
tubes_sel
| geometry | gm_gmw_monitoringtube_pk | gm_gmw.href | gm_gmw_fk | tube_status | tube_in_use | tube_top_diameter | screen_top_position | screen_bottom_position | electrode_top_position | electrode_bottom_position | observation | groundwaterLevelDossier | ||
|---|---|---|---|---|---|---|---|---|---|---|---|---|---|---|
| gmw_bro_id | tube_number | |||||||||||||
| GMW000000036339 | 1 | POINT (118632.006 439909.352) | 36441 | https://api.pdok.nl/tno/bro-grondwatermonitori... | 27708 | gebruiksklaar | ja | 63.0 | -2.695 | -3.695 | None | None | value qualifier st... | [GLD000000012845] |
| GMW000000049567 | 2 | POINT (117892.583 439651.861) | 54854 | https://api.pdok.nl/tno/bro-grondwatermonitori... | 40472 | onbekend | ja | NaN | -14.000 | -15.000 | None | None | value qualifier st... | [GLD000000150449] |
| GMW000000088148 | 1 | POINT (118389.168 440186.234) | 101187 | https://api.pdok.nl/tno/bro-grondwatermonitori... | 75843 | gebruiksklaar | onbekend | 63.0 | -2.829 | -3.829 | None | None | Empty DataFrame Columns: [value, qualifier, st... | NaN |
f, ax = plt.subplots(ncols=2, figsize=(10, 5))
ax[0].axis("scaled")
ax[0].axis(extent)
for i, index in enumerate(tubes_sel.index):
    color = f"C{i}"
    obs = tubes_sel.at[index, "observation"]
    marker = "o"
    if obs.empty:
        marker = "x"
    else:
        obs["value"].plot(ax=ax[1], color=color, label=f"{index[0]} filter {index[1]}")
    tubes_sel.loc[[index]].plot(ax=ax[0], marker=marker, color=color)
    ax[0].annotate(
        f"{index[0]}\n filter {index[1]}",
        xy=tubes_sel.loc[index].geometry.centroid.coords[0],
        ha="center",
        xytext=(0, 5),
        textcoords="offset points",
    )

ax[1].legend();